Traffic analysis
To analyze the traffic on your page with Google Analytics, click on Traffic on your home page.
Traffic
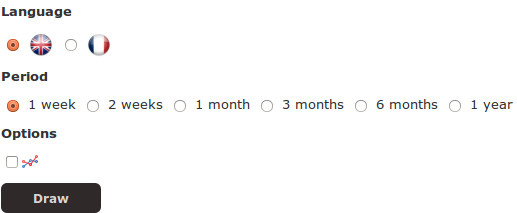
Select the language version of your page you wish to analyze. NOTE: The selector lets you choose only among the different languages your page is published in.
Language
en fr
Select the time period in the past with respect to today's date on which you wish to run the analysis.
Period
1 week 2 weeks 1 month 3 months 6 months 1 year
Press Draw to start collecting the data on Google Analytics and draw the chart.
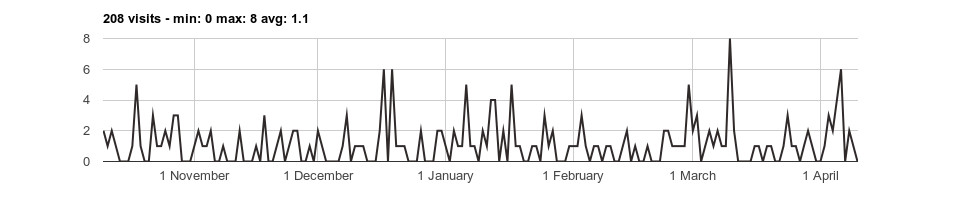
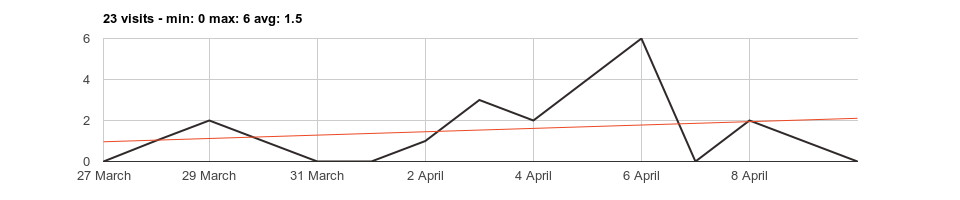
The title of the chart displays the total number of visits, the minimum and maximum number of visits in a single day and the average number of visits per day over the whole period.
Hover the line of the chart with the mouse to display the date for a particular day.
Press Download to download an image of the chart in the PNG format and save it on your system.
Options
trendline
Check the box trendline to draw a line showing the trend of the data.
Comments